
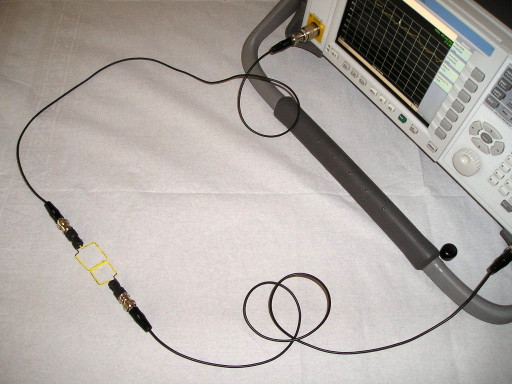
Figure 1. Measuring Loop to Loop Coupling for a Pair of Square Shielded Loops
(end-to-end)
Abstract: Unshielded wire
loops are inexpensive and easy to build. However, capacitive (E field) coupling
has always been a concern when using these simple loops.
Coupling between unshielded wire loops is investigated, included
parasitic capacitive coupling. Performance is compared to shielded
loops and the simple unshielded wire loop is shown to be superior in
some cases to shielded loops.
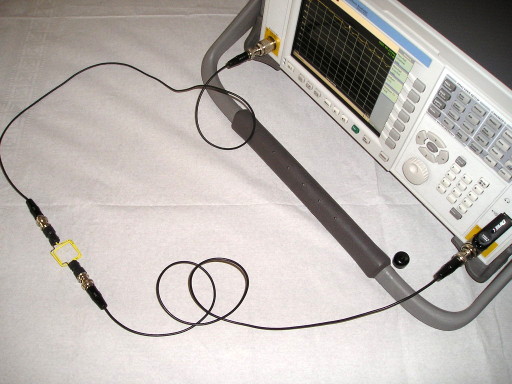
Discussion: Figure 1 shows an overall view of the test setup comprised of a pair of square wire (unshielded) loops connected to an Agilent N1996A spectrum analyzer set
up to perform a two port insertion loss measurement. The two loops are
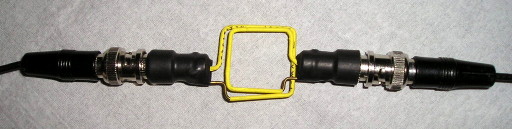
positioned end-to-end. A close-up of the two loops is shown in Figure 2. The loops are about one inch, a few cm, on a side.
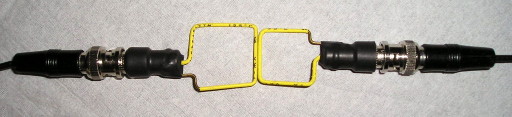
In Figure 2, the loops are reversed in position, that is the + side of one loop (center conductor of BNC) is opposite the - of the other loop (ground side of BNC). This will be referred to as the "reversed" direction. By inverting one of the loops in Figure 2 the "normal" direction is obtained (+ side to + side of the loops). Data is presented for both directions. Capacitive coupling between the loops would cause the normal and reversed positions of the loops to yield different responses or cause resonant responses such as with the shielded loops discussed in the June 2008 Technical Tidbit.
If only magnetic field coupling existed between the loops, the change resulting when one of the loops is reversed would be a 180 degree phase shift in the output, which would not change the spectrum analyzer plot. If significant capacitive coupling existed between the loops, the output of the receiving loop would be the combination of the inductive and capacitive components. Since the phase of the inductive component is reversed when one loop is reversed but the phase of the capacitive component is not, the spectrum analyzer plot will be different.
Figures 3 and 4 show the loop-to-loop transmission from 10 MHz to 1 GHz for the reversed case and normal cases of the two loops as explained above. In last month's June 2008 Technical Tidbit, it was shown that the loop-to-loop transmission for a pair of shielded loops in the end-to-end configuration contained a deep resonance of about 30 dB due to inter-loop capacitance. Neither Figure 3 or Figure 4 shows such a resonance, with the frequency response being relatively flat by comparison. The differences between Figure 3 and Figure 4 are about 6 dB maximum at a few frequencies and the traces are not as smooth as the shielded loops. However the "lumps" in the frequency response in Figures 3 and 4 are only a few dB in peak amplitude, much smaller than the 30 dB resonant dip seen in the shielded loop case discussed in the June 2008 Technical Tidbit.
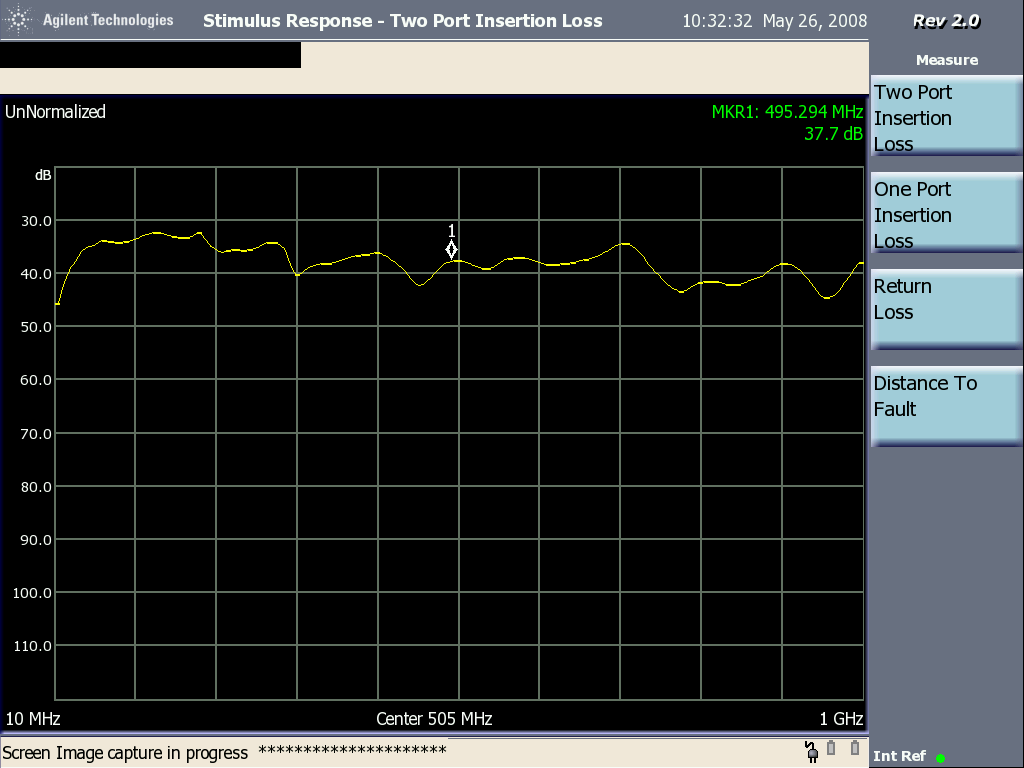
Figure 3. Response of End-to-End Loops (reversed directions)
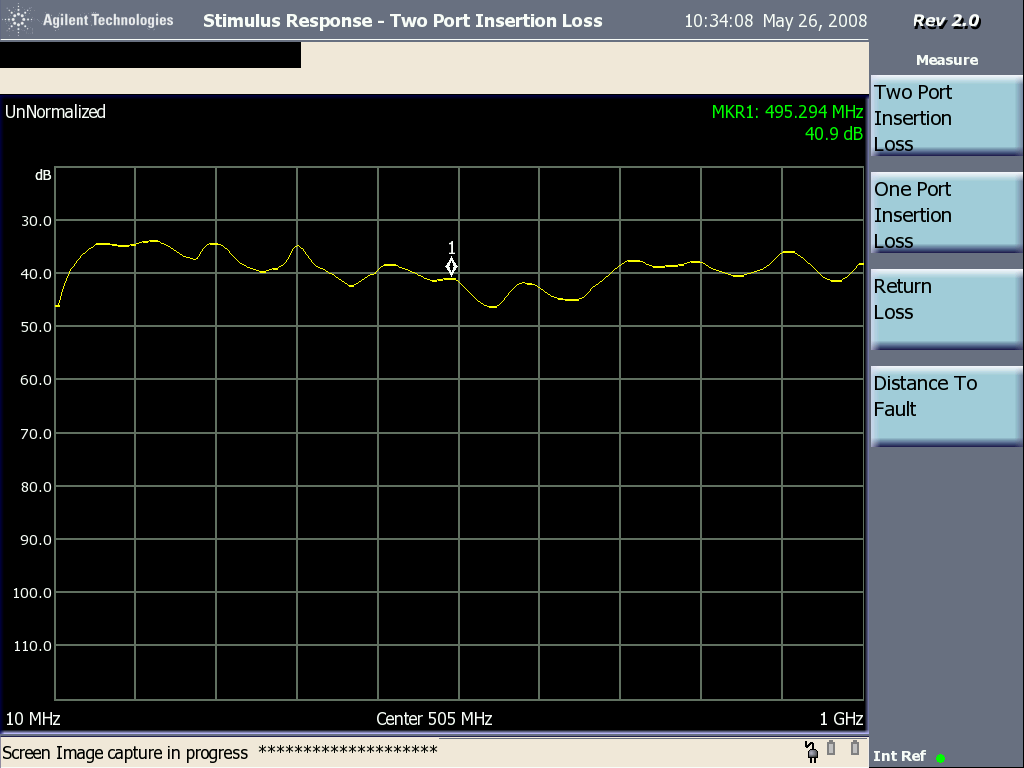
Figure 4. Response of End-to-End Loops (normal directions)
The relatively flat frequency response in Figures 3 and 4 are indicative that simple wire loops may be useful for injecting signals into circuit board paths and cables by inductive coupling. Using loops for this purpose will be covered in Part 4 of this series of Technical Tidbits.
Figure 5 shows the overview of a related case where the loops are overlapped to insure maximum coupling. Figure 6 shows a close-up of the loops. Notice in Figure 6 that the loops are arranged in the normal position as opposed to reversed in Figure 2, that is the side of the loops connected to the BNC center pin (or shield connection) are both on the same side.
Figures 7 and 8 show the coupling from 10 MHz to 1 GHz for the setups of Figures 5 and 6 in both the normal and reversed orientations. The difference between the two traces is only a few dB, and without shielding! The response curves look very close to the response of shielded loops that are overlapped, within a few dB.

Figure 7. Response of Overlapped Loops (normal direction)

Figure 8. Response of Overlapped Loops (reversed direction)
In Figure 2, the loops are reversed in position, that is the + side of one loop (center conductor of BNC) is opposite the - of the other loop (ground side of BNC). This will be referred to as the "reversed" direction. By inverting one of the loops in Figure 2 the "normal" direction is obtained (+ side to + side of the loops). Data is presented for both directions. Capacitive coupling between the loops would cause the normal and reversed positions of the loops to yield different responses or cause resonant responses such as with the shielded loops discussed in the June 2008 Technical Tidbit.
If only magnetic field coupling existed between the loops, the change resulting when one of the loops is reversed would be a 180 degree phase shift in the output, which would not change the spectrum analyzer plot. If significant capacitive coupling existed between the loops, the output of the receiving loop would be the combination of the inductive and capacitive components. Since the phase of the inductive component is reversed when one loop is reversed but the phase of the capacitive component is not, the spectrum analyzer plot will be different.
Figure 2. Close-up of Loops for Coupling Measurement
(reversed direction)
(reversed direction)
Figures 3 and 4 show the loop-to-loop transmission from 10 MHz to 1 GHz for the reversed case and normal cases of the two loops as explained above. In last month's June 2008 Technical Tidbit, it was shown that the loop-to-loop transmission for a pair of shielded loops in the end-to-end configuration contained a deep resonance of about 30 dB due to inter-loop capacitance. Neither Figure 3 or Figure 4 shows such a resonance, with the frequency response being relatively flat by comparison. The differences between Figure 3 and Figure 4 are about 6 dB maximum at a few frequencies and the traces are not as smooth as the shielded loops. However the "lumps" in the frequency response in Figures 3 and 4 are only a few dB in peak amplitude, much smaller than the 30 dB resonant dip seen in the shielded loop case discussed in the June 2008 Technical Tidbit.
Figure 3. Response of End-to-End Loops (reversed directions)
Figure 4. Response of End-to-End Loops (normal directions)
The relatively flat frequency response in Figures 3 and 4 are indicative that simple wire loops may be useful for injecting signals into circuit board paths and cables by inductive coupling. Using loops for this purpose will be covered in Part 4 of this series of Technical Tidbits.
Figure 5 shows the overview of a related case where the loops are overlapped to insure maximum coupling. Figure 6 shows a close-up of the loops. Notice in Figure 6 that the loops are arranged in the normal position as opposed to reversed in Figure 2, that is the side of the loops connected to the BNC center pin (or shield connection) are both on the same side.
Figure 5. Measuring Loop to Loop Coupling for a Pair of Square Shielded Loops
(overlapped)
(overlapped)
Figure 6. Close-up of Loops for Coupling Measurement
(normal direction)
(normal direction)
Figures 7 and 8 show the coupling from 10 MHz to 1 GHz for the setups of Figures 5 and 6 in both the normal and reversed orientations. The difference between the two traces is only a few dB, and without shielding! The response curves look very close to the response of shielded loops that are overlapped, within a few dB.
Figure 7. Response of Overlapped Loops (normal direction)
Figure 8. Response of Overlapped Loops (reversed direction)
Summary: Frequency
response plots of the coupling between small simple wire loops is reasonably
flat, similar to shielded loops. This suggests that simple
square wire loops may be well suited for injecting signals into circuit
boards by inductive coupling, a topic covered in Part 4 of this series.
Additional articles on this website related to this topic are:
- Signal and Noise Measurement Techniques Using Magnetic Field Probes (~600K)
- (1999 IEEE EMC Symposium paper)
- December 2000, An Easy to Build Shielded Magnetic Loop Probe
- June 2006, Measuring Structural Resonances
- October 2007, Using Noise Injection for Troubleshooting Circuits
- November 2007, Measuring Structural Resonances in the Time Domain - Part 1
- February 2008, Using Resonant Frequency Measurements to Extract Circuit Parameters
(Calculating the Capacitance of a BNC Barrel Adapter) - May 2008, The Square Shielded Loop - Part 1
(Construction Details) - June 2008, The Square Shielded Loop - Part 2, Parasitic Coupling
Equipment used in this Technical Tidbit:
- The spectrum analyzer used is an Agilent N1996A.
Click here for a description of my latest seminar titled (now available online as a WebEx seminar):
EMC
Lab Techniques for Designers
(How to find EMC problems and have some confidence your system will pass EMC testing while it is still in your lab).
(How to find EMC problems and have some confidence your system will pass EMC testing while it is still in your lab).
 |
Check
out my podcast containing mp3 format short tutorials, tech news and
more! Just click on the
microphone to see the listing
of free
audio programs. Content is added every week on technical
topics so check back frequently. |
Home