
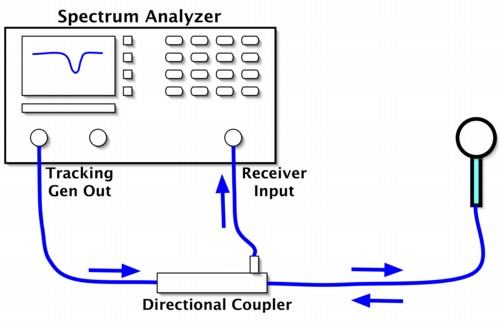
Figure 1. Using a Directional Coupler and a Loop to Measure Resonances
Abstract: Structural resonances in equipment
hardware can cause unwanted emissions from electronic equipment or make
an existing emissions or immunity problem worse. A simple arrangement
for measuring the resonant frequencies of physical structures in
systems is described.
Figure 1 shows the basic method. A shielded magnetic loop (~600K pdf file) is excited by the tracking generator of a spectrum analyzer through a directional coupler. The tracking generator output frequency matches the input frequency of the receiver input. If one were to directly connect the tracking generator to the receiver input, a straight line would result on the display at the level of the tracking generator output amplitude.
The spectrum analyzer is set to sweep the frequency range of interest. Since a small loop, a fraction of a wavelength around its circumference, is not a good radiator, most of the energy will be reflected back on the coax from the loop. The directional coupler takes some of this reflected energy and directs it to the coupler output which is connected to the spectrum analyzer input. The result will usually be a generally straight line with some frequency shaping from the loop and the coupler.
If the loop is then held near a physical structure that has a resonant frequency within the span of the spectrum analyzer's frequency sweep, the structure will absorb energy at its resonant frequency. The absorbed energy from the loop is not reflected and a dip in the amplitude displayed on the screen will be seen at that frequency, like the trace on the screen illustrated in Figure 1.
Figure 2 shows a small square shielded loop being held next to a short wire bonding a circuit board to an underlying metal plane. The board and metal plane were used in my Technical Tidbit for May 2002. The loop will couple energy into the resonant circuit formed by the capacitance of the board to the metal plane and the inductance of the connection(s) between the board and metal plane. As the analyzer sweeps through the resonant frequency, a dip in the trace on the screen will be seen.
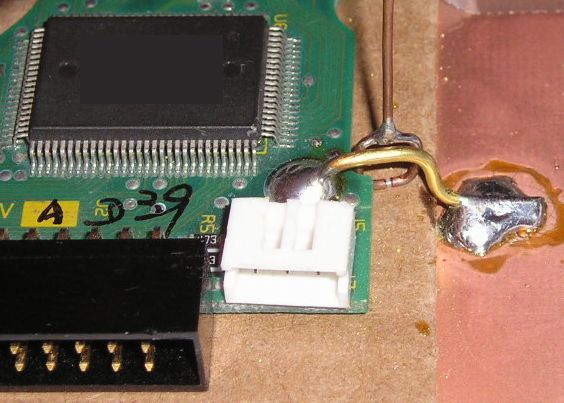
Figure 2. Measuring the Resonant Frequency of a PWB Mounted Over a Metal Chassis
I have used this method to measure the resonant frequency of the tines on an integrated circuit heat sink. In this case, a very small loop is held near the base of a tine to excite the tine like a quarter wave vertical antenna over the ground plane of the heat sink. In one case, there was a strong resonance about 2.1 GHz.
To maximize the effect, you may need to play around with the frequency span of the analyzer as well as other settings such as the resolution bandwidth. In general, sweep the minimum range of frequencies that you can but not so small that you can be at resonance and not realize it.
The loop circumference should be somewhat smaller than one half wavelength at the the highest frequency to be swept. When the loop circumference reaches one half wavelength, the loop goes into resonance and itself becomes a good radiator making it less useful for finding resonances in the equipment near or above this frequency.
One can also use a network analyzer and just plot the reflection coefficient looking into the cable feeding the loop. This may allow normalizing the case where the loop is in open air to a straight line making it easier to spot resonances. The network analyzer also eliminates the need for a directional coupler as well.
Summary: Using a directional coupler, a spectrum analyzer with a tracking generator, and a small shielded loop, system resonant frequencies can be easily determined. Knowledge of such frequencies can help in mitigating emissions and immunity problems in equipment or preventing them in the first place.
Discussion: Structural resonances
in equipment hardware can cause or exacerbate emissions and immunity
problems. Being able to identify resonances, such as the resonant
frequency of the tines on a heatsink or a printed wiring board mounted
over a metal chassis, can help solve emissions and immunity problems.
Scott Roleson of HP described such a technique in his December 1998 article in Medical Device & Diagnostic Industry Magazine. Scott's technique with refinements and adjusted for today's higher frequencies is the basis of this article.
Figure 1 shows the basic method. A shielded magnetic loop (~600K pdf file) is excited by the tracking generator of a spectrum analyzer through a directional coupler. The tracking generator output frequency matches the input frequency of the receiver input. If one were to directly connect the tracking generator to the receiver input, a straight line would result on the display at the level of the tracking generator output amplitude.
The spectrum analyzer is set to sweep the frequency range of interest. Since a small loop, a fraction of a wavelength around its circumference, is not a good radiator, most of the energy will be reflected back on the coax from the loop. The directional coupler takes some of this reflected energy and directs it to the coupler output which is connected to the spectrum analyzer input. The result will usually be a generally straight line with some frequency shaping from the loop and the coupler.
If the loop is then held near a physical structure that has a resonant frequency within the span of the spectrum analyzer's frequency sweep, the structure will absorb energy at its resonant frequency. The absorbed energy from the loop is not reflected and a dip in the amplitude displayed on the screen will be seen at that frequency, like the trace on the screen illustrated in Figure 1.
Figure 2 shows a small square shielded loop being held next to a short wire bonding a circuit board to an underlying metal plane. The board and metal plane were used in my Technical Tidbit for May 2002. The loop will couple energy into the resonant circuit formed by the capacitance of the board to the metal plane and the inductance of the connection(s) between the board and metal plane. As the analyzer sweeps through the resonant frequency, a dip in the trace on the screen will be seen.
Figure 2. Measuring the Resonant Frequency of a PWB Mounted Over a Metal Chassis
I have used this method to measure the resonant frequency of the tines on an integrated circuit heat sink. In this case, a very small loop is held near the base of a tine to excite the tine like a quarter wave vertical antenna over the ground plane of the heat sink. In one case, there was a strong resonance about 2.1 GHz.
To maximize the effect, you may need to play around with the frequency span of the analyzer as well as other settings such as the resolution bandwidth. In general, sweep the minimum range of frequencies that you can but not so small that you can be at resonance and not realize it.
The loop circumference should be somewhat smaller than one half wavelength at the the highest frequency to be swept. When the loop circumference reaches one half wavelength, the loop goes into resonance and itself becomes a good radiator making it less useful for finding resonances in the equipment near or above this frequency.
One can also use a network analyzer and just plot the reflection coefficient looking into the cable feeding the loop. This may allow normalizing the case where the loop is in open air to a straight line making it easier to spot resonances. The network analyzer also eliminates the need for a directional coupler as well.
Summary: Using a directional coupler, a spectrum analyzer with a tracking generator, and a small shielded loop, system resonant frequencies can be easily determined. Knowledge of such frequencies can help in mitigating emissions and immunity problems in equipment or preventing them in the first place.
Other articles on this website and other sources related to this topic are:
- Scott Roleson's original article in the January 1998 issue of Medical Device & Diagnostic Industry Magazine
- Signal and Noise Measurement Techniques Using Magnetic Field Probes (~600K)
- (1999 IEEE EMC Symposium paper)
- April 2002, Printed Wiring Board Coupling to a Nearby Metal Plane
- May 2002, Printed Wiring Board Coupling to a Nearby Metal Plane, Part 2: ESD Immunity
- July 2002, Inexpensive, but Useful Test Equipment
- October 2002, Printed Wiring Board Coupling to a Nearby Metal Plane, Part 3: System Measurements
- March 2004, Coupling Effects Between Equipment Enclosures (interactions with grounding conductors)
Coming soon for private on-site delivery and as a public seminar is my latest single day seminar titled: EMC Lab Techniques for Designers (How to find EMC problems and have some confidence your system will pass EMC testing while it is still in your lab).
 |
Check out my podcast containing mp3 format short tutorials, tech news and more! Just click on the microphone to see the listing
of free
audio programs. Content is added every week on technical topics so check back frequently. |
Home