
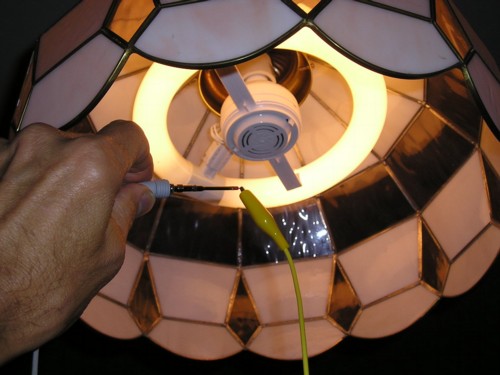
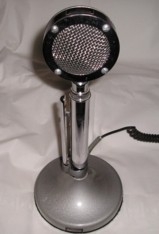
Figure 1. Electronic Fluorescent Light Near Scope Probe
Abstract: Electronic fluorescent lights
are capable of generating significant EMI. The nature of the EMI
resulting from internal switching used by such a light is presented. The
amplitudes measured are significant and could affect high impedance
analog circuits.
Discussion: Figure 1 shows a
scope probe with a one meter test lead attached to the probe tip and held
near an electronic fluorescent light in an overhead fixture. One might
expect the probe to pick up some EMI at such a close distance, and it does, but
the setup shown in Figure 2 also picks up significant EMI. In Figure 2,
an overhead view is shown of a scope, probe, and one meter test lead
attached to the probe tip. The same light fixture from Figure 1 is just
visible at the top of Figure 2. The distance from the fixture to the
tabletop was just over one meter.
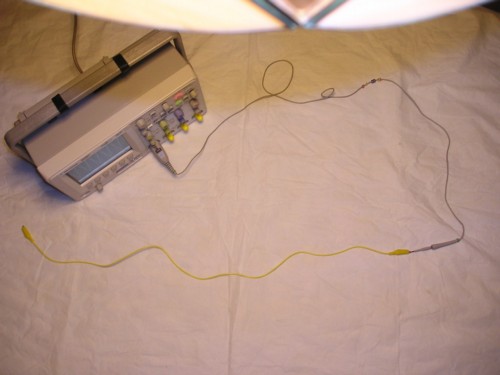
Figure 2. Overhead View of Experiment
(edge of light fixture at top)
Figure 2. Overhead View of Experiment
(edge of light fixture at top)
The probe is a standard 10X Hi-Z
probe with a 10 Megohm input resistance in parallel with 10 picofarads.
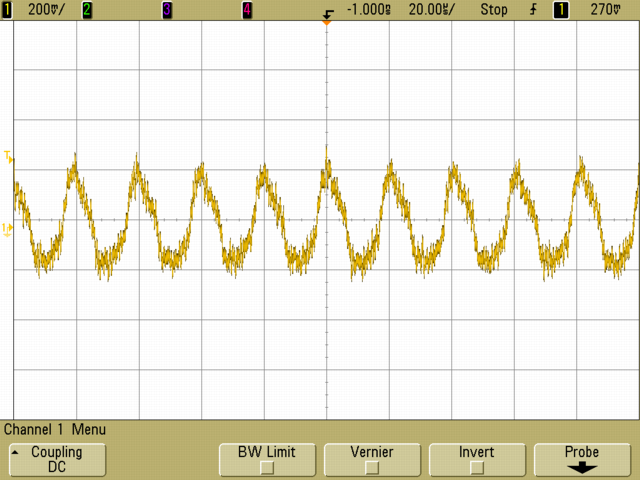
Figure 3 shows the resulting 60 Hz pickup of the probe with a higher
frequency signal riding on it. The 60 Hz peak to peak amplitude is
about 600 mV. Near the center of the screen, the amplitude of the high
frequency component is about 700 mV. A new plot is shown in Figure 4
where the time scale is expanded from 5 ms/div to 20 us/div.
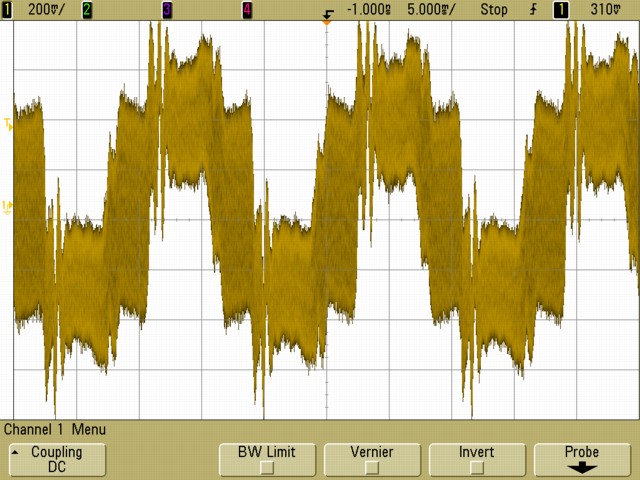
Figure 3. Probe Pickup at about One Meter Showing EMI Riding on 60 Hz Waveform
(Vertical = 200 mV/div, Horizontal = 5 ms/div)
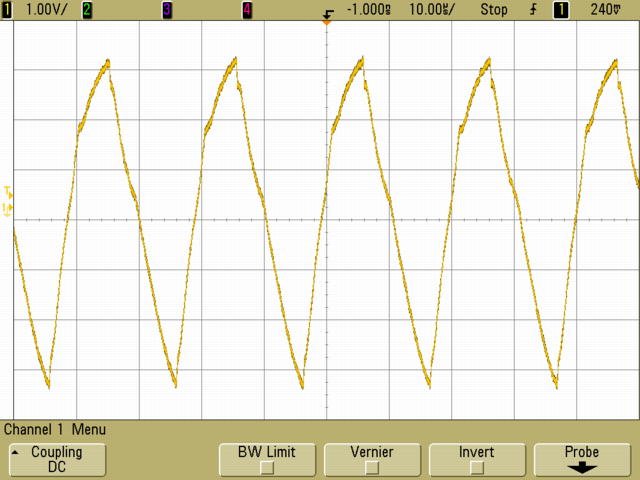
The peak to peak amplitude in Figure 4 is also about 700 mV and the frequency is about 48 kHz. This signal was picked up by the test lead on the table over a meter from the lamp! In order to estimate the source impedance of this voltage, a 100 kOhm resistor was placed across the probe input as shown in Figure 5 to reduce the probe input resistance from 10 MOhms to 100 kOhms.
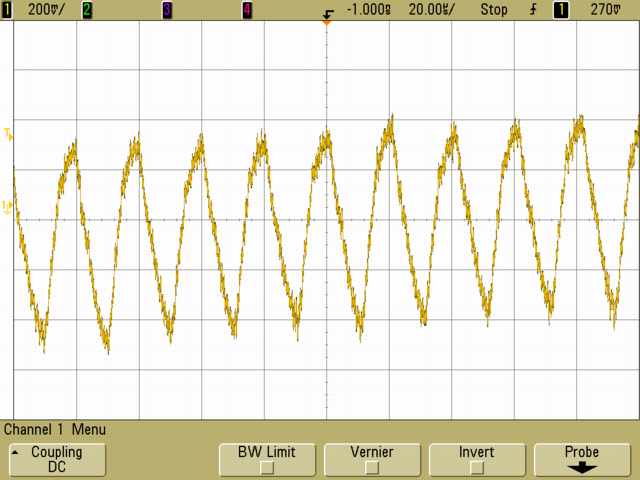
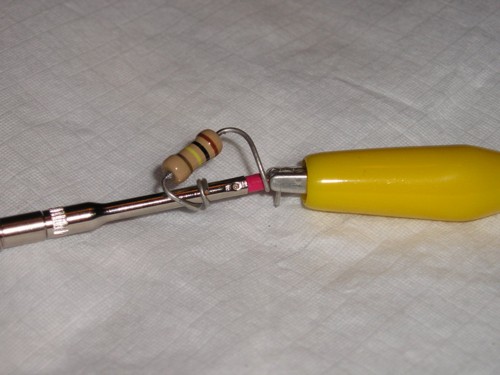
Figure 6 shows the result. The peak to peak amplitude was reduced to about 400 mV indicating that the source impedance was somewhat larger than 100 kOhms, I suspect a capacitive reactance of around 150 kOhms. This would imply a source capacitance (frequency was ~48 kHz) of 21 pF. The 21 pF equivalent capacitance would include the probe input capacitance and capacitances to nearby objects from the test clip as well. The experiment was performed on a wooden table so that should not affect the calculation much.
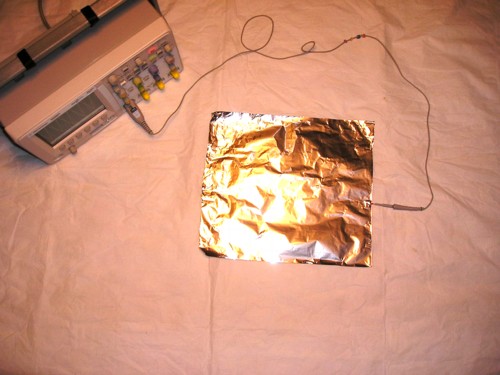
The test was also run with a square sheet of aluminum foil about 1 foot, ~30 cm, on a side as shown in Figure 7. The peak to peak amplitude was increased to about one Volt under this condition, not a large change.
When the probe and test lead were held close to the lamp as shown in Figure 1, repeated below for convenience, the recorded amplitude was much larger as shown in Figure 8. A peak-to-peak reading of ~6.5 Volts was recorded.
This kind of EMI would not likely be a problem for low impedance digital circuits. However, some analog circuits can have a high impedance at 48 kHz and could be affected. In fact, this Technical Tidbit was written as a result of EMI from the same light fixture shown in Figure 1 affecting some of my experiments over the last several years.
The waveforms of Figures 4, 6, and 8 also are rich in harmonics. Given the amplitudes observed, enough high order harmonics to cause RF interference to AM radios and other equipment is a possibility, especially radios with high impedance antennas like AM car radios. A small AM radio does in fact pickup broadband noise modulated by 60 Hz in the vicinity of the lamp.
Figure 3. Probe Pickup at about One Meter Showing EMI Riding on 60 Hz Waveform
(Vertical = 200 mV/div, Horizontal = 5 ms/div)
The peak to peak amplitude in Figure 4 is also about 700 mV and the frequency is about 48 kHz. This signal was picked up by the test lead on the table over a meter from the lamp! In order to estimate the source impedance of this voltage, a 100 kOhm resistor was placed across the probe input as shown in Figure 5 to reduce the probe input resistance from 10 MOhms to 100 kOhms.
Figure 4. Probe Pickup at about One Meter Showing ~48 kHz EMI
(Vertical = 200 mV/div, Horizontal = 20 us/div)
(Vertical = 200 mV/div, Horizontal = 20 us/div)
Figure 5. 100 kOhm Resistor Across Probe Input
Figure 6 shows the result. The peak to peak amplitude was reduced to about 400 mV indicating that the source impedance was somewhat larger than 100 kOhms, I suspect a capacitive reactance of around 150 kOhms. This would imply a source capacitance (frequency was ~48 kHz) of 21 pF. The 21 pF equivalent capacitance would include the probe input capacitance and capacitances to nearby objects from the test clip as well. The experiment was performed on a wooden table so that should not affect the calculation much.
Figure 6. Probe EMI Pickup at about One Meter Across 100 kOhm Resistor
(Vertical = 200 mV/div, Horizontal = 20 us/div))
(Vertical = 200 mV/div, Horizontal = 20 us/div))
The test was also run with a square sheet of aluminum foil about 1 foot, ~30 cm, on a side as shown in Figure 7. The peak to peak amplitude was increased to about one Volt under this condition, not a large change.
Figure 7. Overhead View of Foil Attached to Probe Input
When the probe and test lead were held close to the lamp as shown in Figure 1, repeated below for convenience, the recorded amplitude was much larger as shown in Figure 8. A peak-to-peak reading of ~6.5 Volts was recorded.
Figure 1. Electronic Fluorescent Light Near Scope Probe
(repeated for convenience)
(repeated for convenience)
Figure 8. Probe Pickup at ~5 cm Showing ~48 kHz EMI
(Vertical = 1 V/div, Horizontal = 20 us/div)
(Vertical = 1 V/div, Horizontal = 20 us/div)
This kind of EMI would not likely be a problem for low impedance digital circuits. However, some analog circuits can have a high impedance at 48 kHz and could be affected. In fact, this Technical Tidbit was written as a result of EMI from the same light fixture shown in Figure 1 affecting some of my experiments over the last several years.
The waveforms of Figures 4, 6, and 8 also are rich in harmonics. Given the amplitudes observed, enough high order harmonics to cause RF interference to AM radios and other equipment is a possibility, especially radios with high impedance antennas like AM car radios. A small AM radio does in fact pickup broadband noise modulated by 60 Hz in the vicinity of the lamp.
Summary: An example of EMI at 48 kHz from an electronic fluorescent
light was given. It appears that such lamps could pose an interference
problem for nearby sensitive anlog circuits and AM radios.
Additional articles on this website related to this topic are:
- April 2001, Measurement Error Caused by Probe Input Impedance
- April 2005, Inductive and Capacitive Coupling - Induced Current Characteristics
If you like the information in this article and others on this website, much more information is available in my courses. Click here to see a listing of upcoming courses on design, measurement, and troubleshooting of chips, circuits, and systems.
Click here for a description of my latest seminar to be available soon titled:
EMC
Lab Techniques for Designers
(How to find EMC problems and have some confidence your system will pass EMC testing while it is still in your lab).
(How to find EMC problems and have some confidence your system will pass EMC testing while it is still in your lab).
 |
Check out my podcast containing mp3 format short tutorials, tech news and more! Just click on the microphone to see the listing
of free
audio programs. Content is added every week on technical topics so check back frequently. |
Home