
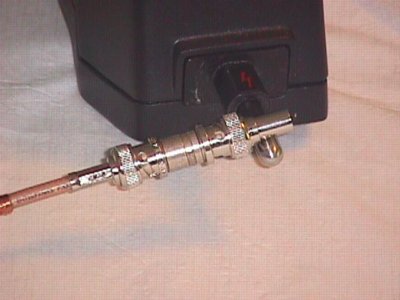
Figure 1. Using an ESD Simulator to Inject Current onto a Shielded Cable
Abstract: A quick test to evaluate
shielding quality of a shielded cable can be made using an ESD
simulator. Data is presented to show limitations of cable shielding due
to shield resistance at low frequencies and as well as high frequency effects.
Discussion: Figure 1 shows the application of ESD current from an ESD simulator to the shield of a coaxial cable terminated in a closed 50 Ohm termination. As the ESD current flows on the cable shield, some undesired ESD "signal" leaks through imperfections in the shield and connectors, and appears to be a signal between the center conductor and shield at the end of the cable. The parameter that relates shield current to the internal apparent signal is shield transfer impedance. Using ESD current as a shield quality test is quick and convenient.
The current waveform generated by an IEC 61000-4-2 ESD simulator contains both high and low frequency components, see Figure 2. The high frequency components are contained in the rising edge of the leading spike (slightly faster than one nanosecond), whereas the low frequency components are contained in the several tens of nanoseconds wave that follows the initial spike. The high and low frequency components of the waveform can be used to quickly determine how well a cable shield works over a wide frequency range.
Figure 3 shows the measurement end of the test setup. The test cable is connected to an oscilloscope and a current probe is used to measure the shield current. The current waveform is delayed by the 1 meter cable connecting the current probe to the scope.
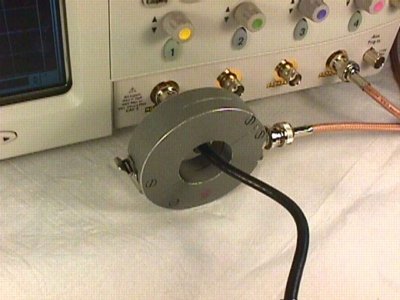
Figure 3. Current Probe at Scope
Figure 4 shows the result for a poor quality, heavily used RG58/U coaxial cable. The ESD simulator was set to about 500 Volts. The red waveform is the ESD current which reaches a peak of about one Ampere. The initial current spike results in a voltage spike of just under seven Volts, not a good cable. This response represents the high frequency performance of the cable and is a combination of resistive and di/dt effects in the shield circuit. Inductance in the shield circuit that is not coupled into the center conductor, such as a pigtail connection of the shield, is one example of an effect that results in an output that is a function of di/dt.
Notice that the lower frequency part of the current waveform results in a voltage at the scope that follows the current waveform, not di/dt. This indicates the cable shield has significant resistance at lower frequencies.
The cable used for this experiment is a cheap RG58/U cable and has a shield of metalized mylar with a few very thin shield wires around the foil. The cable has also been folded and unfolded many times for demonstrations and likely has some broken shield wires as well as cracking of the metalized layer.
Figure 4. High Resistance Shield Voltage and Current Waveforms
Summary: Applying the output of an ESD simulator to a cable shield can be used to get a quick reading on the shield imperfections. Contributions from shield resistance and di/dt effects can be easily seen.
Discussion: Figure 1 shows the application of ESD current from an ESD simulator to the shield of a coaxial cable terminated in a closed 50 Ohm termination. As the ESD current flows on the cable shield, some undesired ESD "signal" leaks through imperfections in the shield and connectors, and appears to be a signal between the center conductor and shield at the end of the cable. The parameter that relates shield current to the internal apparent signal is shield transfer impedance. Using ESD current as a shield quality test is quick and convenient.
The current waveform generated by an IEC 61000-4-2 ESD simulator contains both high and low frequency components, see Figure 2. The high frequency components are contained in the rising edge of the leading spike (slightly faster than one nanosecond), whereas the low frequency components are contained in the several tens of nanoseconds wave that follows the initial spike. The high and low frequency components of the waveform can be used to quickly determine how well a cable shield works over a wide frequency range.
Figure 3 shows the measurement end of the test setup. The test cable is connected to an oscilloscope and a current probe is used to measure the shield current. The current waveform is delayed by the 1 meter cable connecting the current probe to the scope.
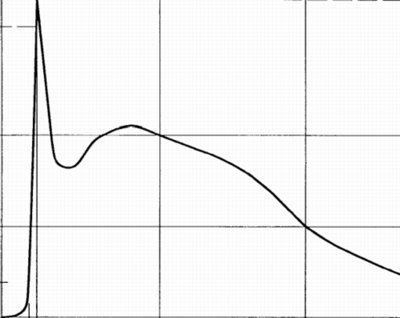
Figure 3. Current Probe at Scope
Figure 4 shows the result for a poor quality, heavily used RG58/U coaxial cable. The ESD simulator was set to about 500 Volts. The red waveform is the ESD current which reaches a peak of about one Ampere. The initial current spike results in a voltage spike of just under seven Volts, not a good cable. This response represents the high frequency performance of the cable and is a combination of resistive and di/dt effects in the shield circuit. Inductance in the shield circuit that is not coupled into the center conductor, such as a pigtail connection of the shield, is one example of an effect that results in an output that is a function of di/dt.
Notice that the lower frequency part of the current waveform results in a voltage at the scope that follows the current waveform, not di/dt. This indicates the cable shield has significant resistance at lower frequencies.
The cable used for this experiment is a cheap RG58/U cable and has a shield of metalized mylar with a few very thin shield wires around the foil. The cable has also been folded and unfolded many times for demonstrations and likely has some broken shield wires as well as cracking of the metalized layer.
Figure 4. High Resistance Shield Voltage and Current Waveforms
Compare the response of Figure 4 to
Figure 5 showing results for a good quality 50 Ohm coaxial cable. This cable is double
shielded and the voltage peak is only about 200 mV instead of 7 Volts.
In addition, there is little low frequency component of the voltage
response. This indicates the shield has low resistance and the voltage
peak is due to di/dt effects of the cable and BNC connectors.
Figure 5. Low Resistance Shield Voltage and Current Waveforms
Summary: Applying the output of an ESD simulator to a cable shield can be used to get a quick reading on the shield imperfections. Contributions from shield resistance and di/dt effects can be easily seen.
Other articles on this website related to this topic are:
- July 2001, A Simple Shielding Effectiveness Measurement
- August 2001, Differential Measurement of Cable EMI Currents
If you like the information in this article and others on this website, much more information is available in my courses. Click here to see a listing of upcoming courses on design, measurement, and troubleshooting of chips, circuits, and systems.
Equipment used in this article includes:
Top of page
Home